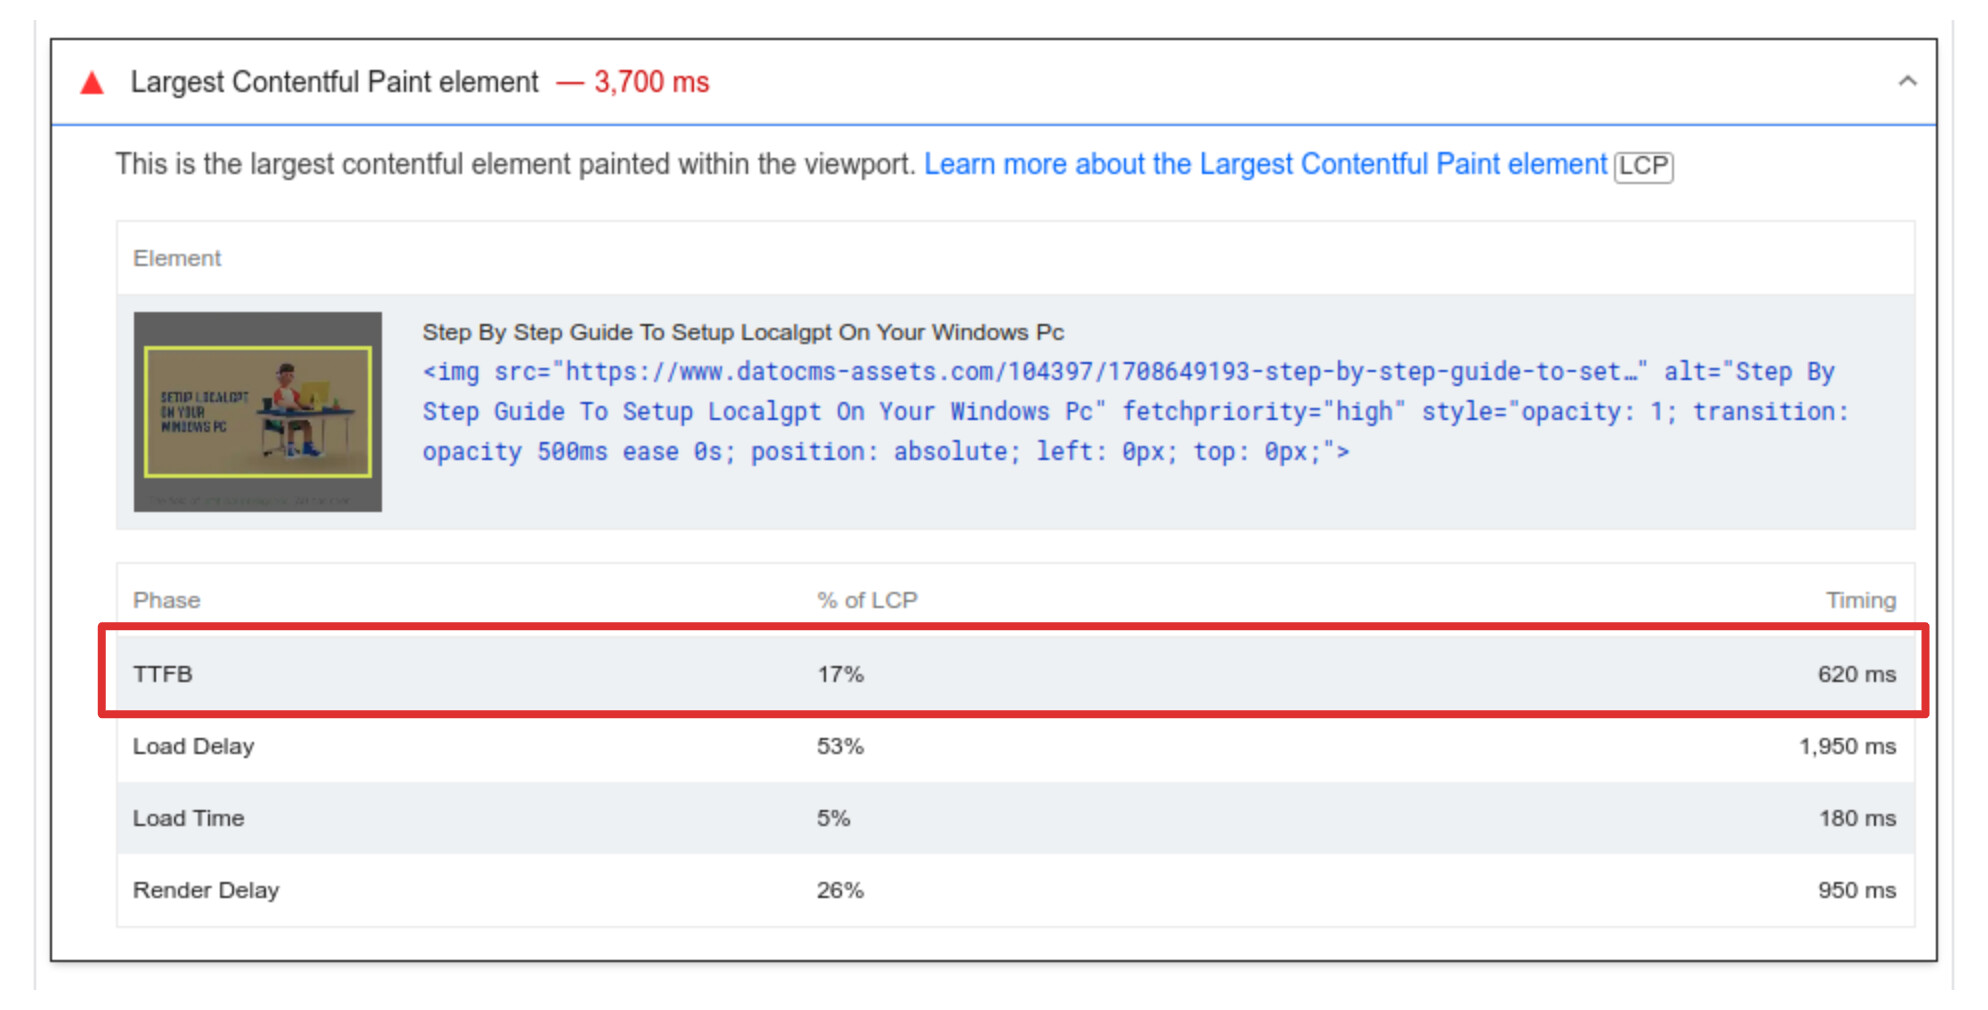
We are seeing a very large TTFB inspite for our image assets when running page speed tests, is there anything we can do to improve this as this latency cascades into our LCP metric and delays it’s render which in turn pulls down our page score.
Is there anyway we can improve this from our end? We are using the React Dato Image component for rendering the image and set the priority as high too.
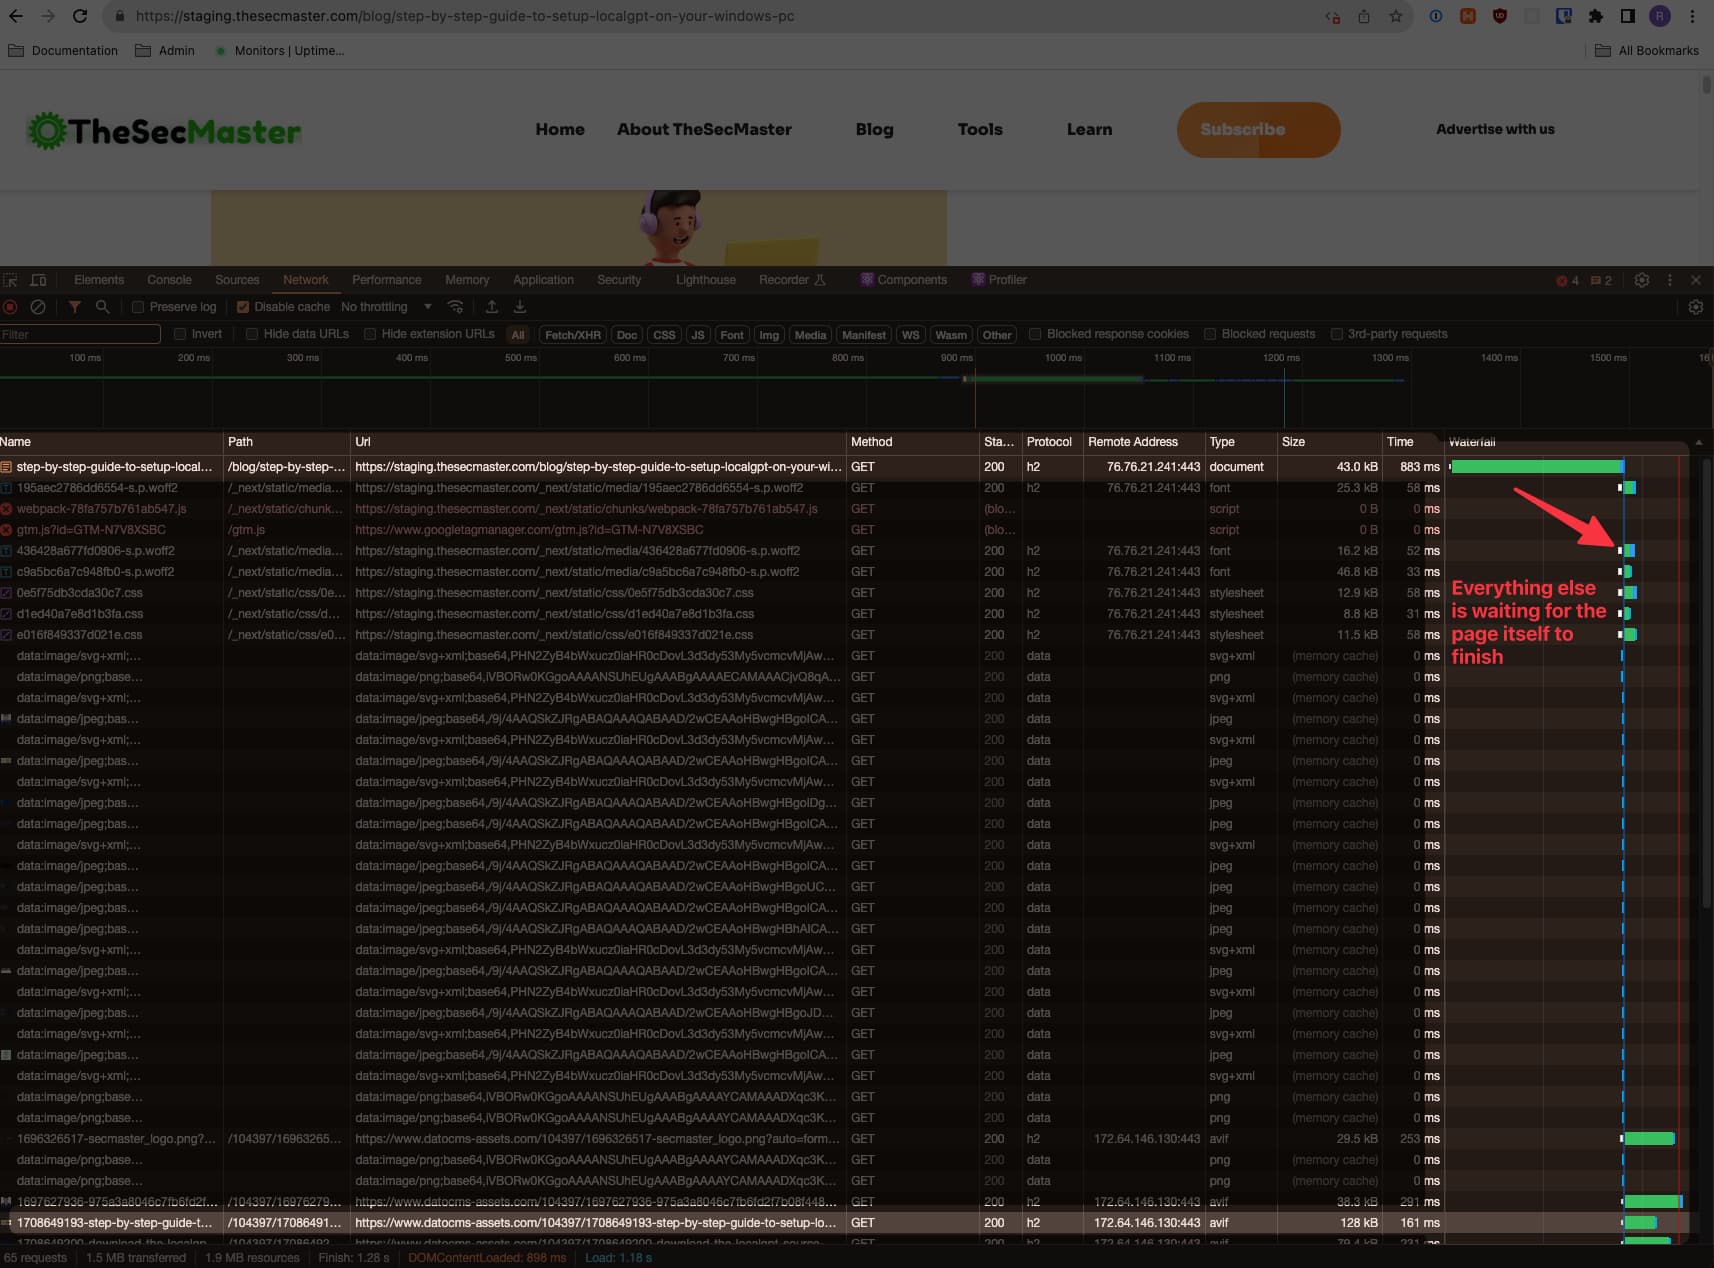
Correct me if I’m wrong, but I think the TTFB is measuring when that LCP starts to download, not how long it takes once it starts? If so, I think your waterfall shows that your page source itself is causing a long blocking pause:
Is that just because it’s on staging? Does this behavior still happen on production Vercel?
The image isn’t loading until the rest of the page is done being downloading and parsed, which is taking quite a while.
Additionally, it looks like there are some things that might be competing for bandwidth, like Google Tag Manager on preload. Does that need to be loaded first, instead of being deferred until all the content is loaded?
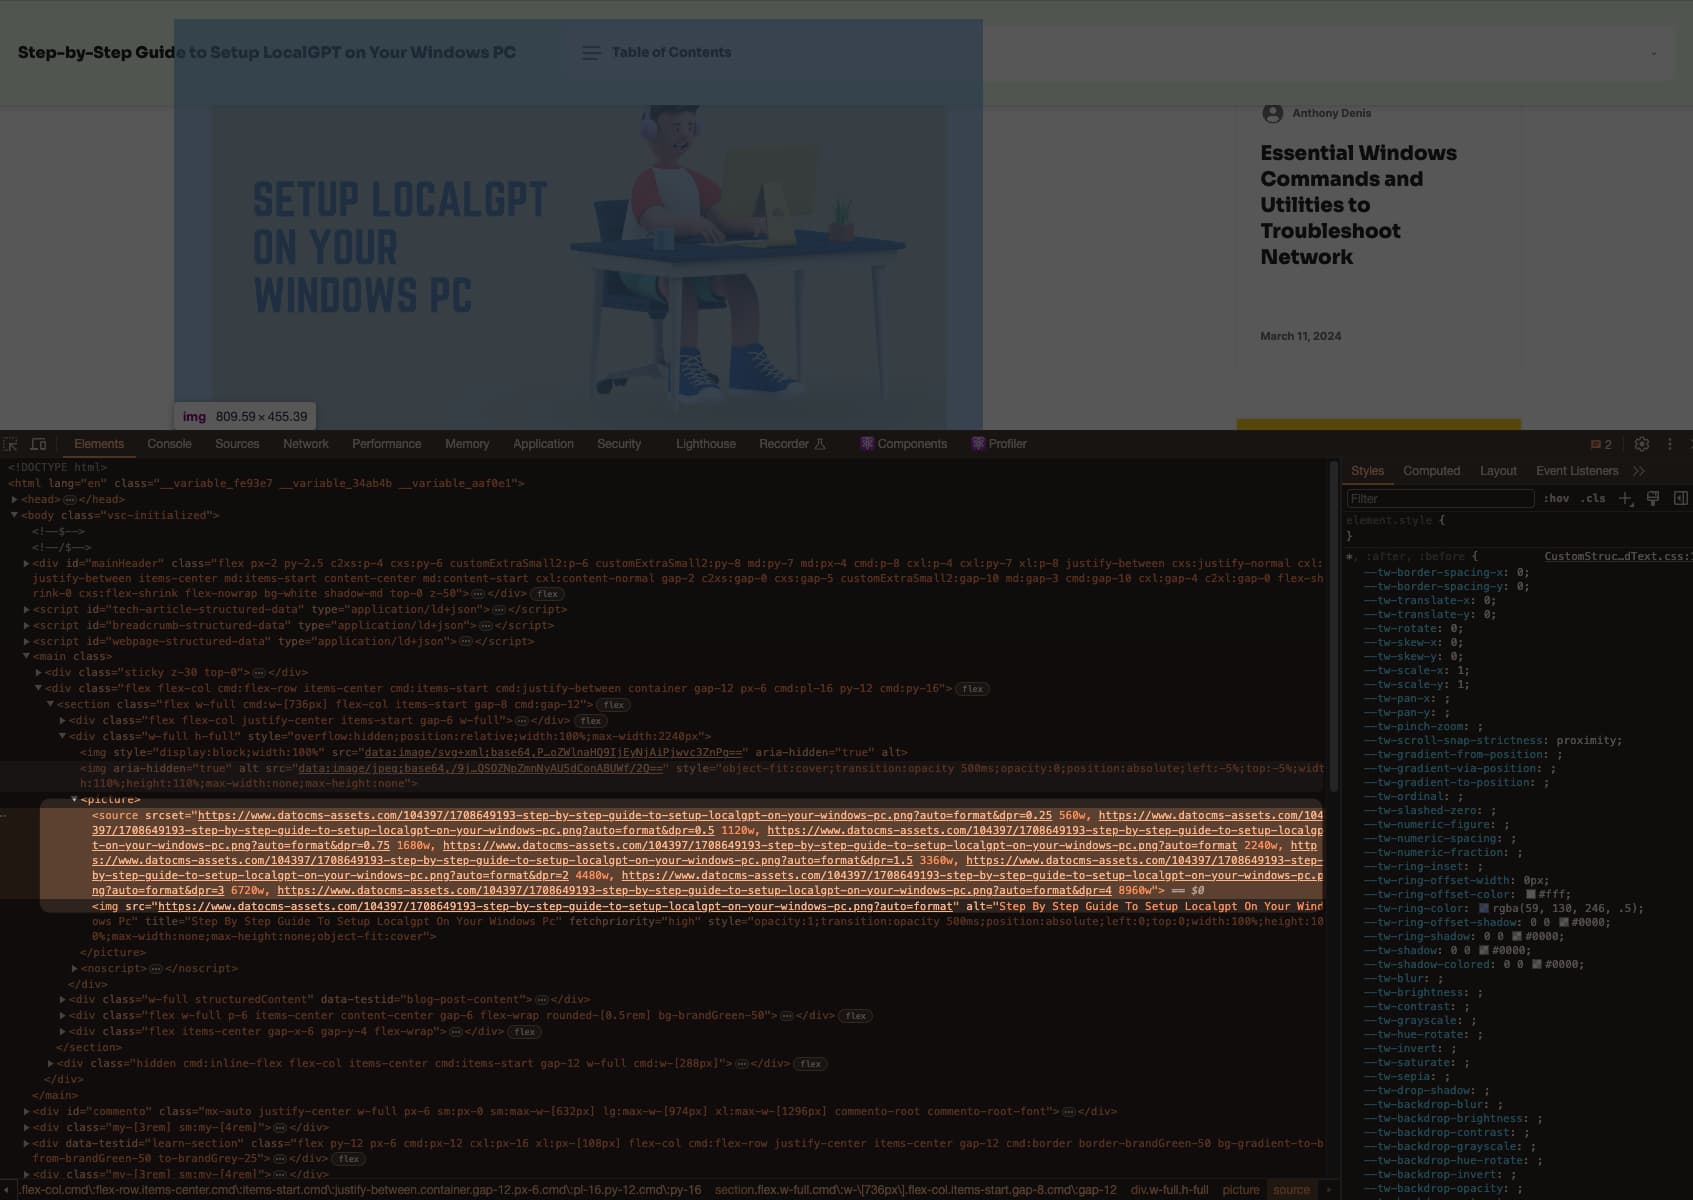
Lastly, it looks to me like the picture’s sourceset is specifying some unnecessarily large dpr versions, which is causing the image to be much bigger than it needs to be (this shouldn’t affect TTFB much, but it does make the image bigger once downloading starts):
The image does load fast when its in the browser and I always figured that TTFB was the measure between the connection with the server and the first byte received from the server from which the image is fetched but that waterfall model does make sense to me.
About the tag manager, we are currently using Third Party Libraries but previously used lazyonload and didn’t notice any change in the speed index.
Sorry, @jude, would it be possible to include more of the parent layout where the image component is being used? I need to better see it in context of the page itself to understand what is causing the blocking, if it’s not the image or component itself being slow (i.e., if you just replaced our component with a regular HTML <img/> tag, it would probably still have a slow TTFB, right…?
Hey @roger sure thing, here’s some more code, hope it helps and thanks for looking into this one.
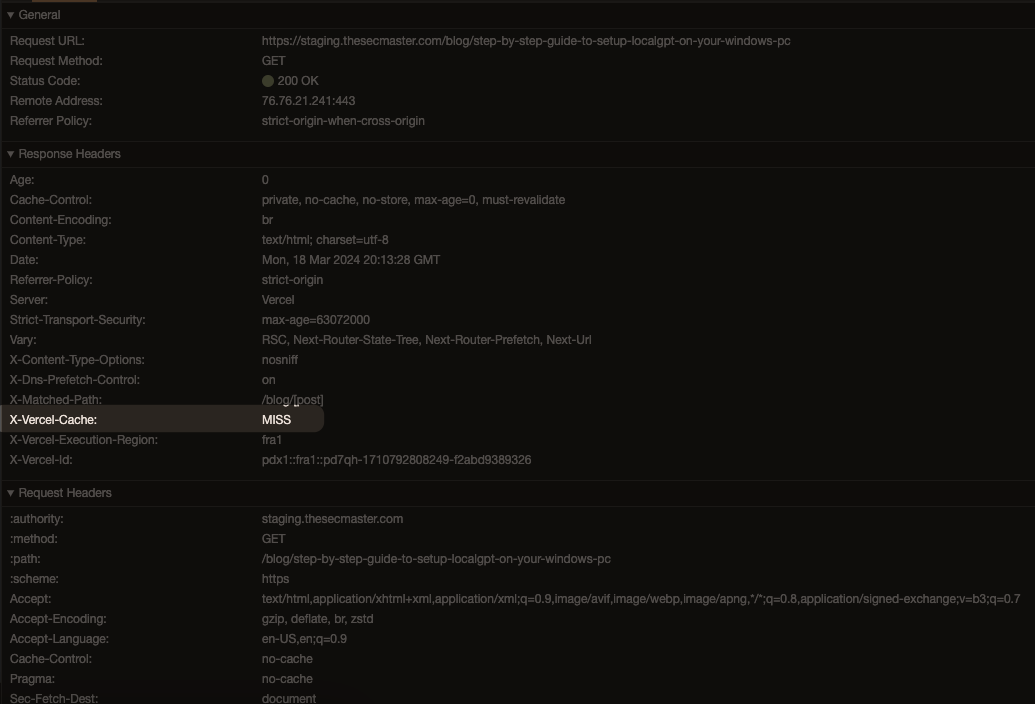
Apologies, I missed replying to the Vercel cache query. So on our end, we’re facing 2 issues that might be relevant to this one
We can’t generate all blog posts at build time since it’s a very large number and it would take a very long time to build.
We tried building a segment of the posts at build time and that did improve the time but we noticed that for some reason, posts that were built at build time would no longer work with draft mode so any updated would not reflect until we did a complete rebuild of the site.
To work around both issues, we simply resorted to a no cache solution for the time being so updates on dato would reflect here instantly when draft mode was enabled.
Sorry @jude, there’s still a quite a few custom functions/components in there that I don’t have, such as:
getLayoutData(), <HideNewsletterContextProvider>, getReadingTime(), <CustomImage/>, etc.
Is there any chance you might be able to share the actual repo? Any of those could be causing a long block, and it’s hard to say without being able to follow the code through Alternatively, you might want to use the JS debugger to step through the rendering lifecycle and see what’s taking the longest…? Or maybe just try taking out components one at a time to see if any of them seem to be causing a long load time?
Regardless, I don’t believe what you are seeing here is directly related to the image. You can easily test that by making a new project and just loading that image by itself, in a react-datocms image component, without the rest of your code.
If you’re not caching at all and are generating each page dynamically on each page load, and it’s taking a while, I believe it may be one of those other functions causing a long-lived operation before JS can continue rendering the page. If this is just for staging, it’s probably OK, but it seems like that’s something worth troubleshooting for production.
Sorry I don’t have a more detailed answer for you right now! Please feel free to share the repo and I can try to take a more in-depth look.
Hey @roger I won’t be able to share the repository at the moment but thank you for offering to run through it, really appreciate that. The points you mentioned are valuable insights and we’ll run through them on our end and see what works and find the component that is the culprit. Thank you!