Describe the issue:
- I was curious if anyone has been able to use react dev tools when developing a plugin. I found some comments online about using this within an iframe, but ran into issues levering it.
- I was trying to narrow down why a component was rerendering more often than expected, but couldn’t use the React Dev Tools extension or using it from the command line to work
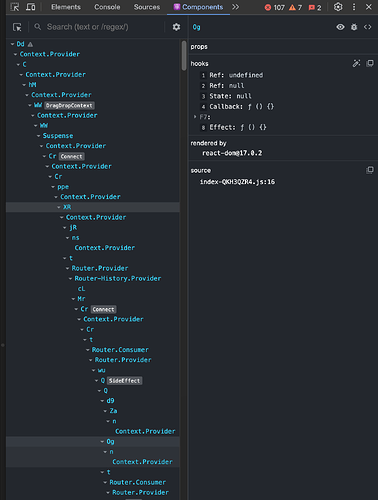
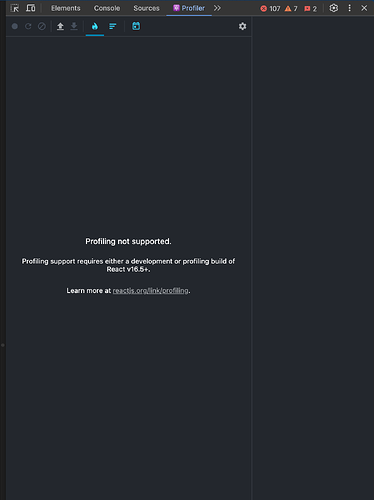
- Using the chrome extension shows the components for the CMS, but couldn’t seem to get it to work for a plugin. The profiling page for the extension never would do anything
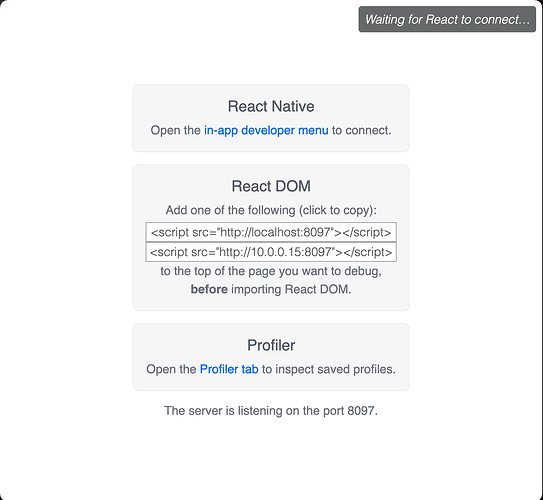
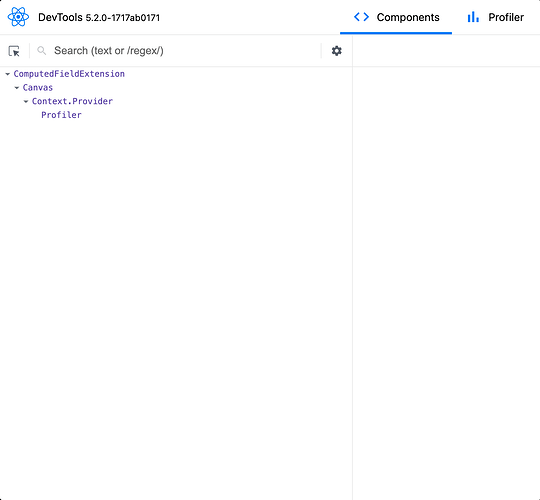
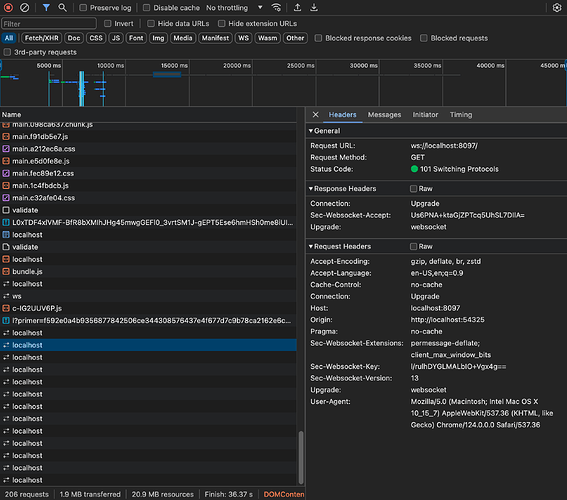
- Using from the command line showed the components of my plugin momentarily, but it seemed to have issues with the websocket connection and kept connecting and disconnecting
Dev Tools Extension
Dev Tools via command line
execute npx react-devtools
Add the script tag to index.html in the head of the html
I wrapped the element with
function onRender(
  id: string,
  phase: string,
  actualDuration: number,
  baseDuration: number,
  startTime: number,
  commitTime: number
) {
  // Aggregate or log render timings...
}

<Profiler id={ctx.plugin.id} onRender={onRender}>
    <Canvas ctx={ctx}>
        // rest of my plugin rendering goes here
    </Canvas>
</Profiler>
I could see my components momentarily and saw in the network logs of chrome dev tools that the localhost websocket seemed to have issues maintaining the connection. I see the following screenshot for maybe 2-3s, then it goes back to trying to find the connection, reloads over and over.
As i was writing this up, i realized i should probably have put Canvas on the outside, but tested that and the same issue occurs.
<Canvas ctx={ctx}>
    <Profiler id={ctx.plugin.id} onRender={onRender}>
        // rest of my plugin rendering goes here
    </Profiler>
</Canvas>
