Hey guys,
First I want to thank the DatoCMS team for the amazing product and support. I’ve been opting to use DatoCMS for small project which don’t require too many other components aside from images and text.
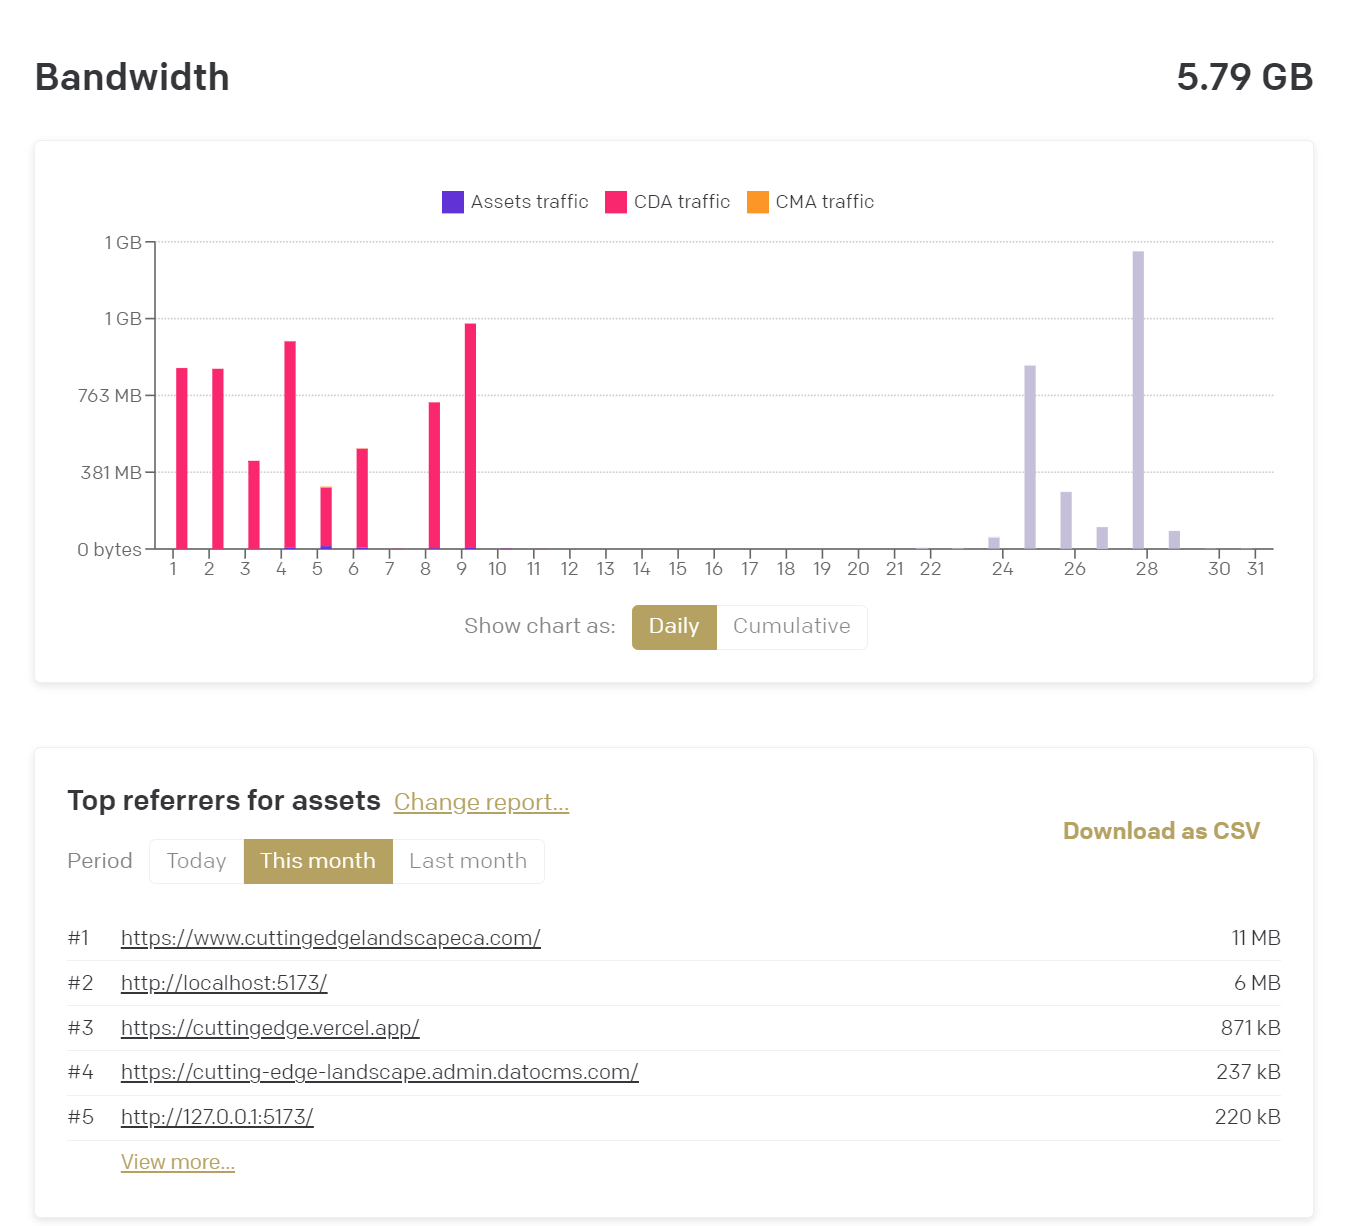
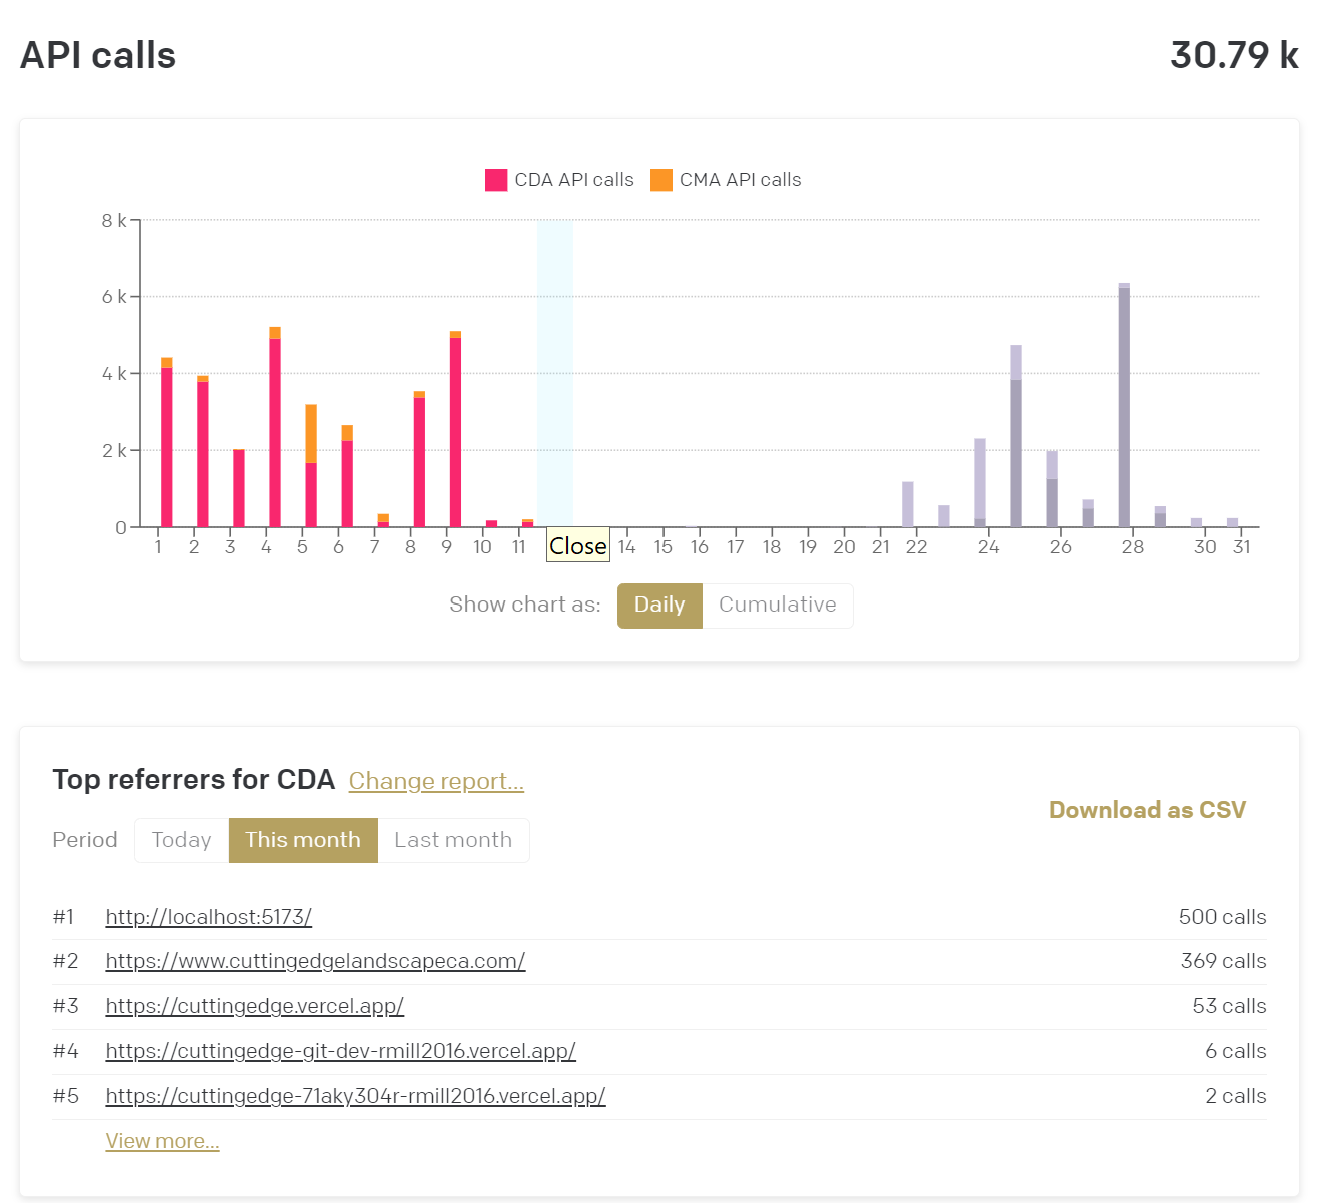
I’m working on a new project now which is a Sveltekit Web Application, implementing Houdini Graphql for data fetching and caching. I’m caching the data correctly according to Houdini Graphql documentation. My question mostly pertains to, could the high number of CDA requests and Bandwidth usage be from Hot Module Reloading (HMR) when developing the site? And if the issue is from HMR, how can I prevent this from happening? I’m mostly just styling the site and viewing the changes at this point Content complete. Let me know if you need any more info on the project.
Hello @rmill2016 and welcome to the community!
When it comes to tracking from where the API calls are coming from or what API Calls are being made (the body of the API call), we can only do so from these two pieces of information:
- If a “referrer” header is included in the request, we can count how many requests had that header and display it in the project usages tab, if the “referrer” header is not included, we can’t count the request on that tab
- We always count from which API token the request came from.
So the best way to keep track of where the API requests are coming from, is to create separate API tokens with custom names, and delegate them to specific project sections. Then you will be able to tell from the number of requests per token, which project sections are responsible to the most requests.
You can also adjust the granularity of the sections by creating more API tokens and using them in smaller sections of the project (or even in single requests if you want)
Additionally, to be sure that the API tokens are only being used where they are intended to, you can click on “Regenerate API Token” on the top right of the Token page, to invalidate the previous token and generate a new one.
So where would I go in the new dashboard navigation to actually view the API requests based on the name of the generated API token? Also my original question was more asking if Hot Module Reloading while developing the website could be a cause for the high number of API requests.
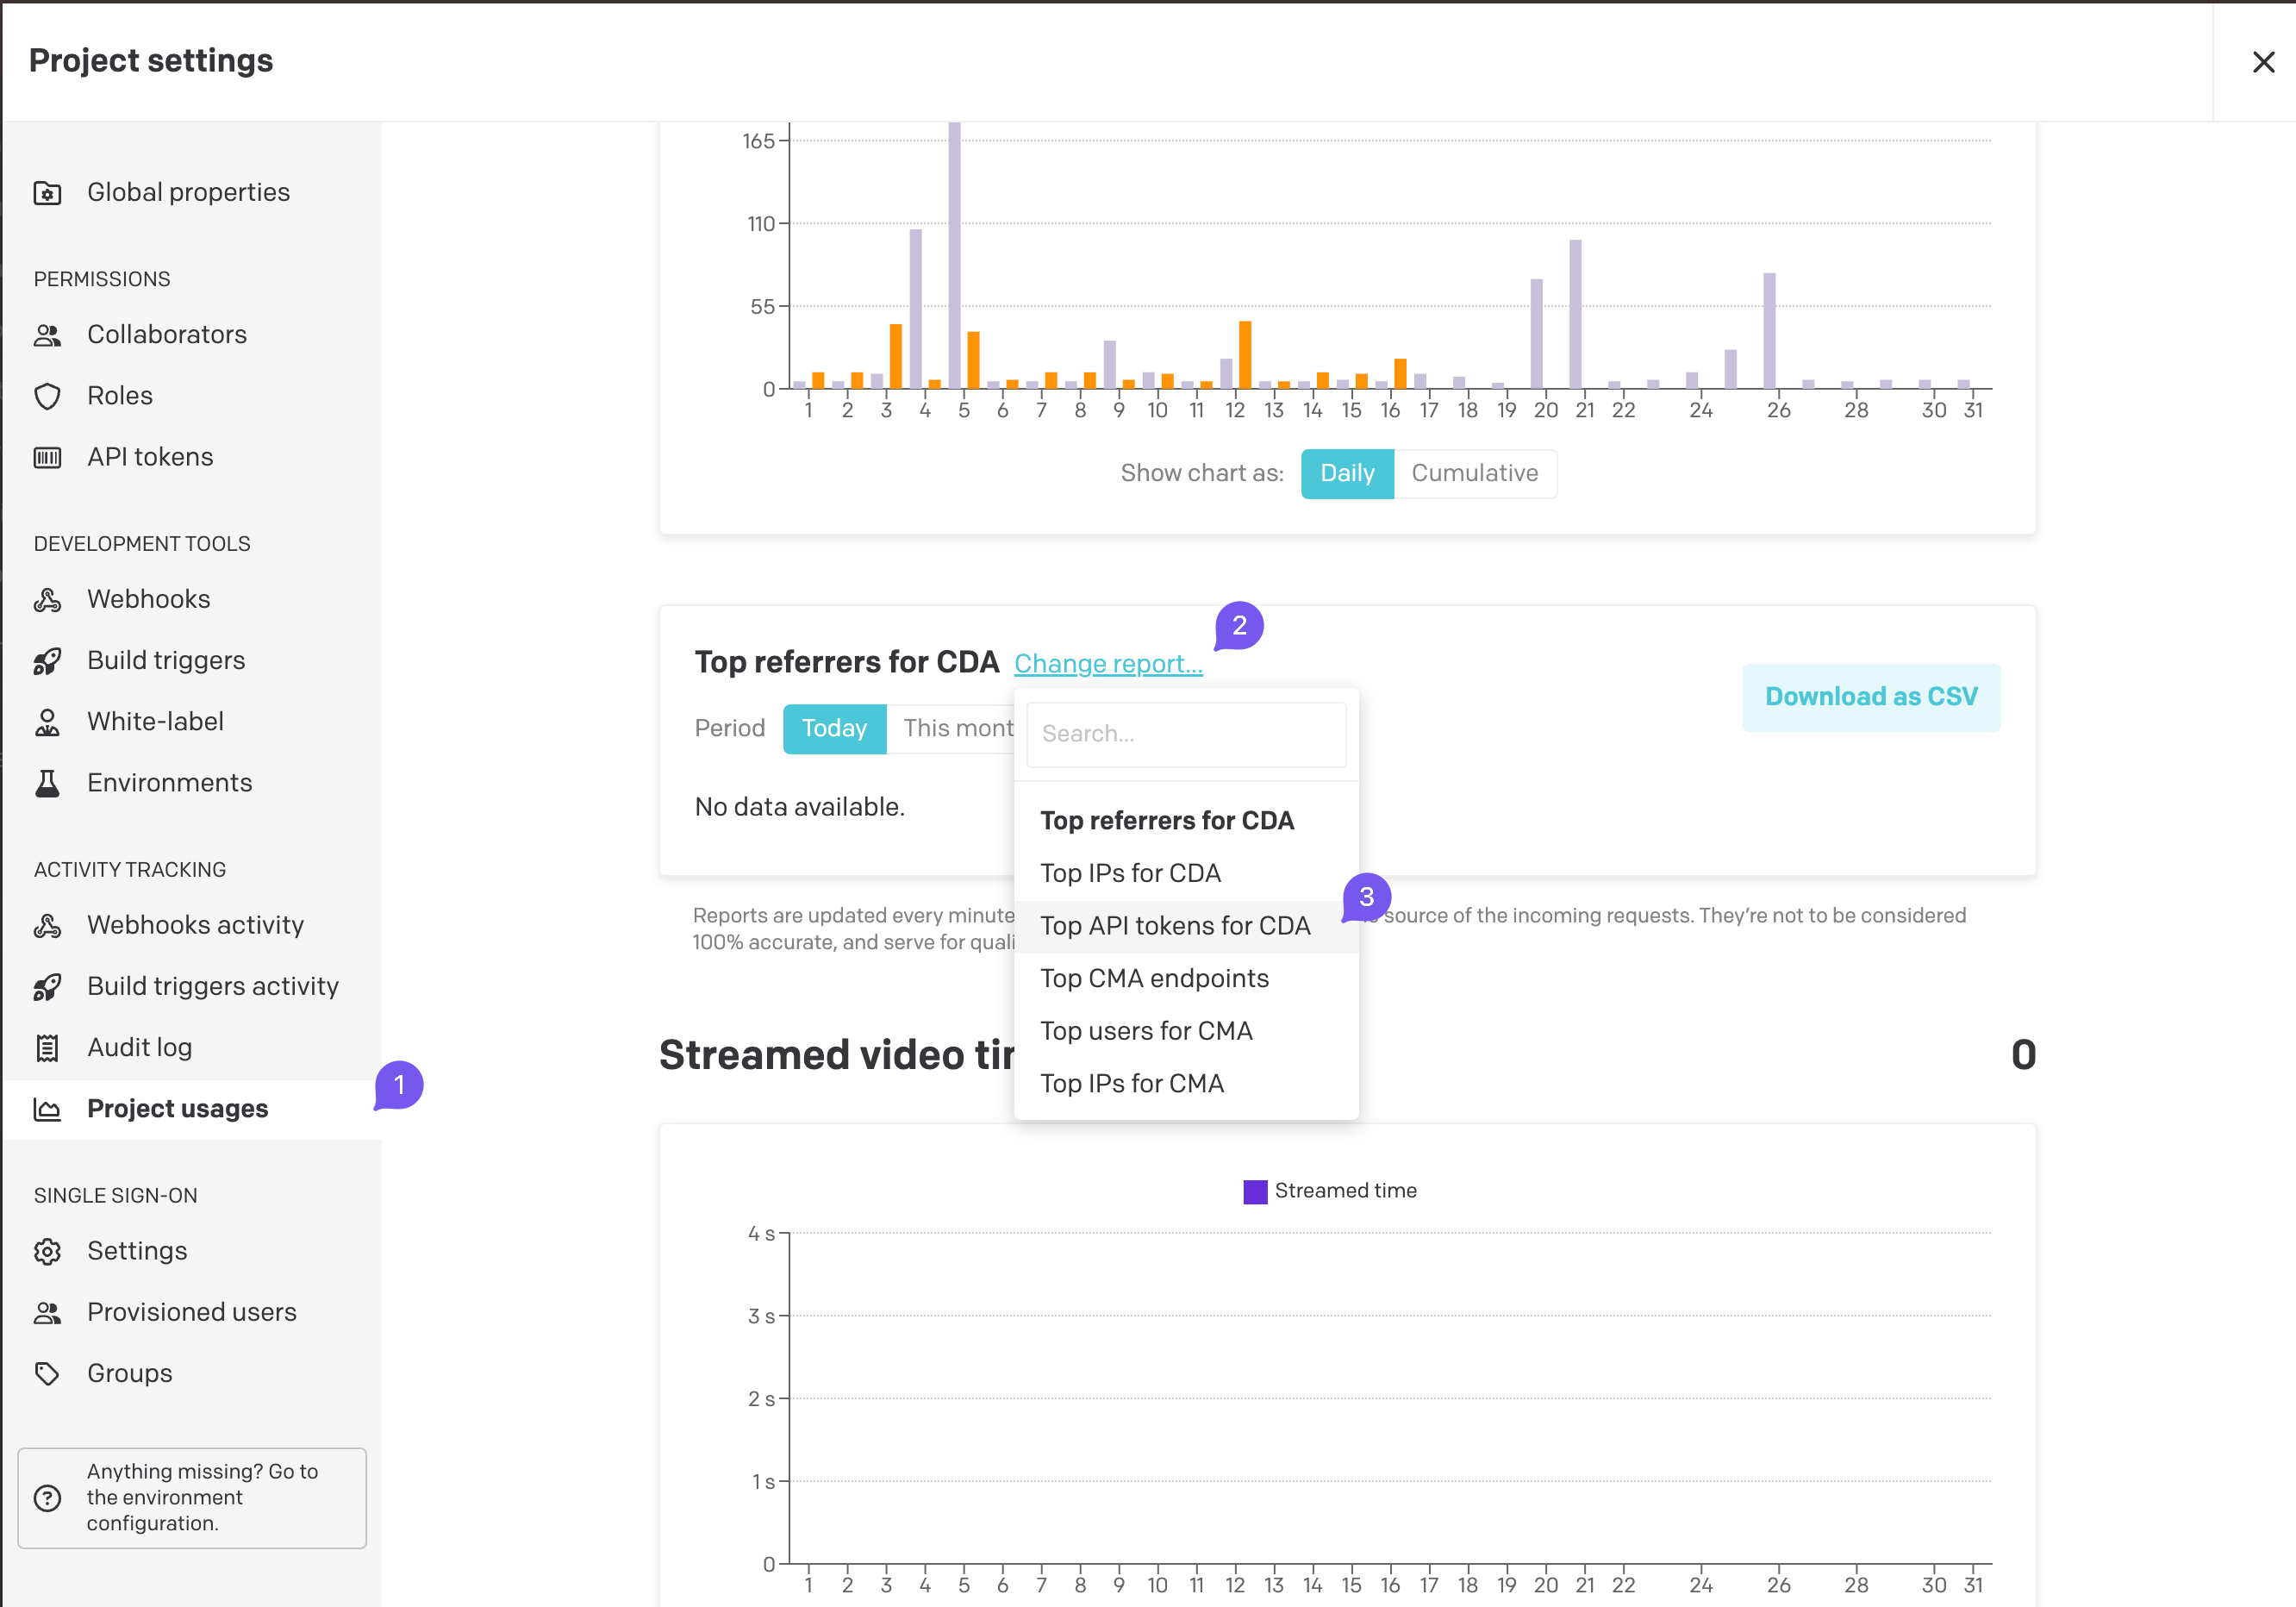
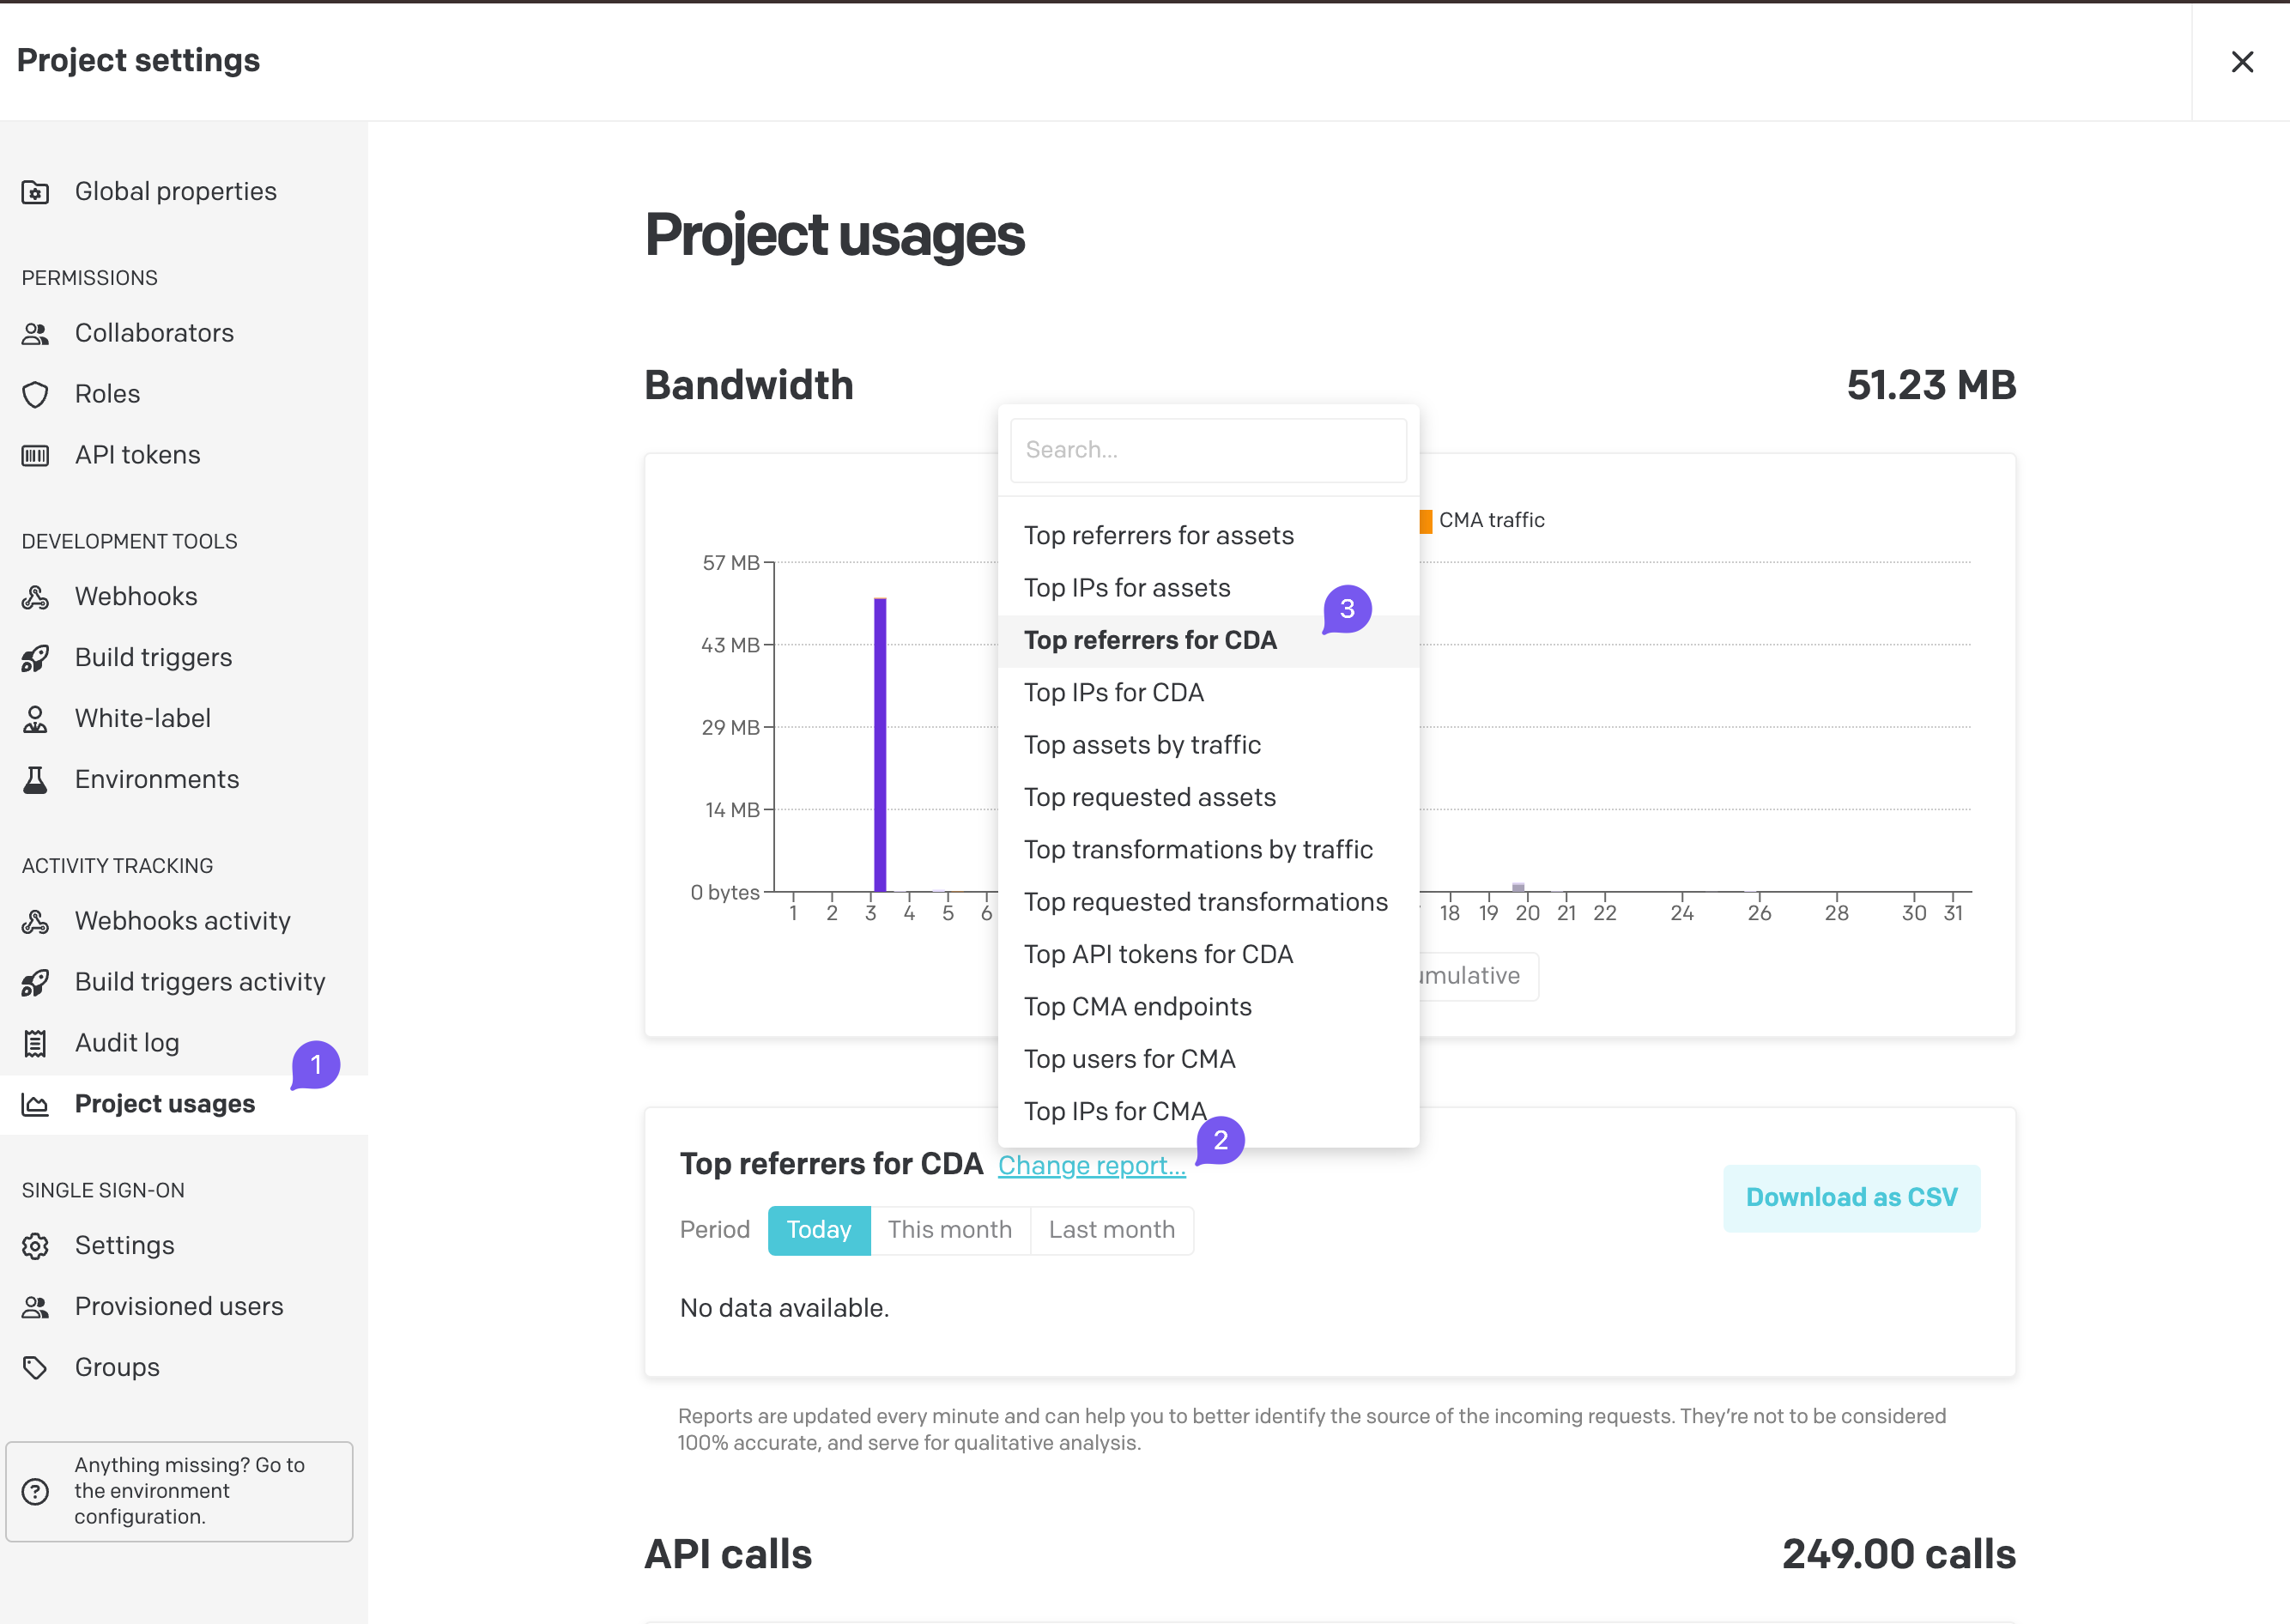
You can go to “project settings”
Then to this menu right here:
If you decide to mark your API requests with a referrer header instead, you can go to this menu right here:
And yes, the HMR is very most likely the cause of the very large number of requests, specially if it is doing a new request to dato on every code change (witch is the default)
Hi!
I’m jut staring to use Houdini and have the same problem. I didn’t encountered this kind of issues with other graphql libs.
By any chance : Did you manage to target the problem and prevent HMR to trigger so many requests?